Since its formation in 1836 the United States Patent and Trademark Office (USPTO) has received over 11.6 million patent applications. In 2022, US patents are estimated to be worth just over $3 trillion.
Patent statistics show how this robust industry breaks down. This guide examines facts and stats about the patent industry in the US to help the reader better understand how this massive industry breaks down.
How Many Patents Are Granted Each Year by the USPTO?
The USPTO examines patent applications to determine patent eligibility. The USPTO may deny a patent for many reasons such as lack of novelty, if the invention was obvious, failure to meet subject matter requirements, and lack of utility.
How many patents are granted each year?: The average amount of patent applications granted each year by the USPTO from 2011-2020 is 299,070.
How may patents are applied for each year?: The average amount of patent applications filed each year at the USPTO from 2011-2020 is 581,452.
What is the approval rate of a patent application?: The average approval rate of a patent application by the USPTO from 2011-2020 is 52.8%. This approval rate varies by type of patent and year. *Note that it takes many months for the USPTO to examine a patent application after it has been filed. For example, the application for a patent granted in 2020 may have been filed in 2018 or before. From 2011-2020 the USPTO received 5,814,517 patent applications and granted 2,990,695 patents.
What is the approval rate of each type of patent application?: The average approval rate of each type of patent determined by totals from 2011-2020 is:
- Utility Patents: 51.4%
- Design Patents: 69.2%
- Plants Patents: 96.4%
Patent approval rate by type of patent.
| Utility Patents Approval Rate (2011-2020) | ||
|---|---|---|
| Year | Utility Applications Filed | Utility Patents Granted |
| 2020 | 597,175 | 352,049 |
| 2019 | 621,453 | 354,430 |
| 2018 | 597,141 | 307,759 |
| 2017 | 606,956 | 318,828 |
| 2016 | 605,571 | 303,049 |
| 2015 | 589,410 | 298,408 |
| 2014 | 578,802 | 300,677 |
| 2013 | 571,612 | 277,835 |
| 2012 | 542,815 | 253,155 |
| 2011 | 503,582 | 224,505 |
| Total | 5,814,517 | 2,990,695 |
| Design Patent Approval Rate (2011-2020) | ||
|---|---|---|
| Year | Design Applications Filed | Design Patents Granted |
| 2020 | 47,838 | 34,877 |
| 2019 | 46,847 | 34,794 |
| 2018 | 45,083 | 30,497 |
| 2017 | 43,340 | 30,870 |
| 2016 | 42,571 | 28,873 |
| 2015 | 39,097 | 25,986 |
| 2014 | 35,378 | 23,657 |
| 2013 | 36,034 | 23,468 |
| 2012 | 32,799 | 21,951 |
| 2011 | 30,467 | 21,356 |
| Total | 399,454 | 276,329 |
| Plant Patent Approval Rate (2011-2020) | ||
|---|---|---|
| Year | Plant Applications Filed | Plant Patents Granted |
| 2020 | 1,171 | 1,398 |
| 2019 | 1,134 | 1,275 |
| 2018 | 1,079 | 1,208 |
| 2017 | 1,059 | 1,311 |
| 2016 | 1,177 | 1,235 |
| 2015 | 1,140 | 1,074 |
| 2014 | 1,063 | 1,072 |
| 2013 | 1,406 | 847 |
| 2012 | 1,149 | 860 |
| 2011 | 1,139 | 823 |
| Total | 11,517 | 11,103 |
What Is the Most Common Type of Patent?
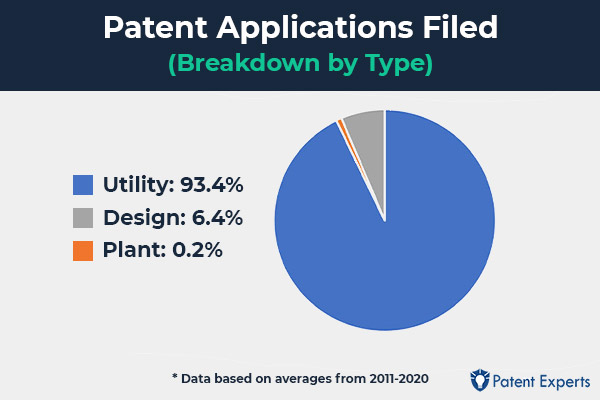
Aggregate data from 2011-2020 shows that Utility patents are the most common type of patent.
Percent of total applications:
- Utility: 93.4%
- Design: 6.4%
- Plant: 0.2%
What Is the Most Common Technology Patented?
The U.S. Patent Classification System (USPC) currently contains approximately 475 total classes. A report released by the USPTO in 2015 shows that the class with the most patents at that time was “Drug, Bio-Affecting and Body Treating Compositions.”
| Top 10 Technology Classes Patented | |||
|---|---|---|---|
| All time Rank (2015) | Classification | Patents all time total (2015) | Patents Granted in 2015 |
| 1 | Drug, Bio-Affecting and Body Treating Compositions | 193,598 | 12,712 |
| 2 | Active, Solid-State Devices (e.g., Transistors, Solid-State Diodes | 111,446 | 12,014 |
| 3 | Semiconductor Device Manufacturing: Process | 103,025 | 4,970 |
| 4 | Multiplex Communications | 97,420 | 11,027 |
| 5 | Chemistry: Molecular Biology and Microbiology | 80,839 | 4,066 |
| 6 | Stock Material or Miscellaneous Articles | 77,926 | 2,967 |
| 7 | Telecommunications | 76,789 | 7,902 |
| 8 | Computer Graphics Processing and Selective Visual Display Systems | 64798 | 7,638 |
| 9 | Measuring and Testing | 56,891 | 2,266 |
| 10 | Electrical Computers and Digital Processing Systems: Multicomputer Data Transferring | 56,001 | 6,358 |
Patent Statistics by State
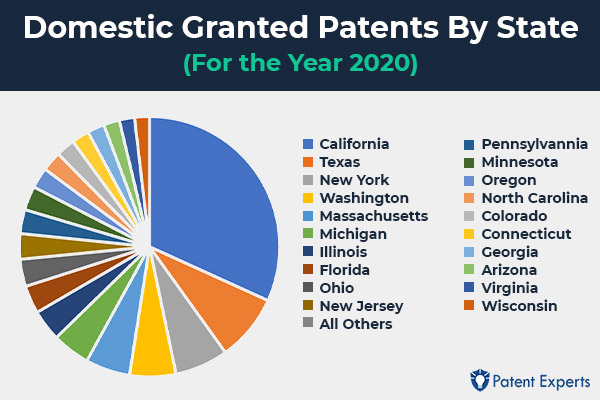
In 2020 applicants from California received the greatest number of patents of any US state. That year California received 50,496 patents, or 27.6% of granted patents whose applicant was from the US. California received more patents than the next 5 highest states combined.
| Granted Patents by State (2020) | |||
|---|---|---|---|
| Rank | State | Granted Patents | Share of Domestic Granted Patents |
| 1 | California | 50,496 | 27.6% |
| 2 | Texas | 13,192 | 7.2% |
| 3 | New York | 10,540 | 5.6% |
| 4 | Washington | 9,112 | 5.0% |
| 5 | Massachusetts | 8,790 | 4.8% |
| 6 | Michigan | 7,478 | 4.1% |
| 7 | Illinois | 6,175 | 3.4% |
| 8 | Florida | 5,513 | 3.0% |
| 9 | Ohio | 5,386 | 2.9% |
| 10 | New Jersey | 5,027 | 2.7% |
| 11 | Pennsylvania | 4,737 | 2.6% |
| 12 | Minnesota | 4,734 | 2.6% |
| 13 | Oregon | 4,093 | 2.2% |
| 14 | North Carolina | 3,917 | 2.1% |
| 15 | Colorado | 3,740 | 2.0% |
| 16 | Connecticut | 3,478 | 1.9% |
| 17 | Georgia | 3,365 | 1.8% |
| 18 | Arizona | 3,140 | 1.7% |
| 19 | Virginia | 3,002 | 1.6% |
| 20 | Wisconsin | 2,939 | 1.6% |
| All others | 24,293 | 13.3% | |
Patent Statistics by Country
Applicants from the United States account for the largest group granted patents in 2020 by the USPTO. Other countries whose applicants received a significant number of patents include Japan, China, South Korea, and Germany. More than half of patents were granted to applicants outside of the United States.
| USPTO Patent Grants by Country of applicant (2020) | |||
|---|---|---|---|
| Rank | Country | Granted Patents | Share of Patents Granted |
| 1 | United States | 183,147 | 47.1% |
| 2 | Japan | 53,779 | 13.8% |
| 3 | China | 26,845 | 6.9% |
| 4 | South Korea | 23,705 | 6.1% |
| 5 | Germany | 19,173 | 4.9% |
| 6 | Taiwan | 13,105 | 3.4% |
| 7 | United Kingdom | 8,470 | 2.2% |
| 8 | Canada | 7,914 | 2.0% |
| 9 | France | 7,614 | 2.0% |
| 10 | India | 5,984 | 1.5% |
| 11 | Israel | 4,844 | 1.2% |
| 12 | Italy | 3,794 | <1% |
| 13 | Netherlands | 3,417 | <1% |
| 14 | Sweden | 3,411 | <1% |
| 15 | Switzerland | 3,252 | <1% |
| 16 | Australia | 2,330 | <1% |
| 17 | Austria | 1,608 | <1% |
| 18 | Finland | 1,552 | <1% |
| 19 | Belgium | 1,482 | <1% |
| 20 | Denmark | 1,374 | <1% |
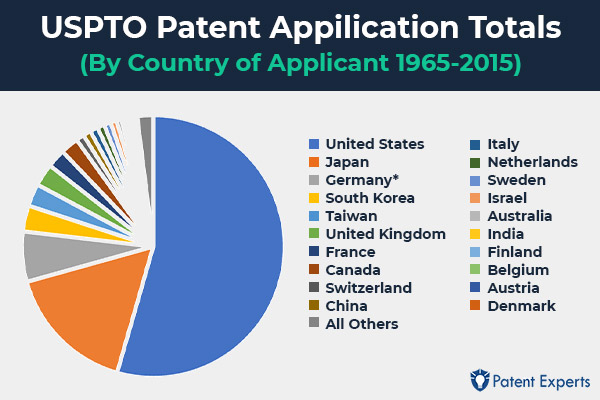
From 1965-2015 there were a total of 11,796,475 patent applications filed at the USPTO. More than half (54.44%) of those applications originated from an applicant in the United States.
| USPTO Patent Application Totals by Country of Applicant (1965-2015) | ||
|---|---|---|
| Rank | Country | Patent Applications Filed |
| 1 | United States | 6,422,381 |
| 2 | Japan | 1,913,460 |
| 3 | Germany* | 729,737 |
| 4 | South Korea | 377,016 |
| 5 | Taiwan | 327,336 |
| 6 | United Kingdom | 325,601 |
| 7 | France | 269,577 |
| 8 | Canada | 261,614 |
| 9 | Switzerland | 117,606 |
| 10 | China | 114,289 |
| 11 | Italy | 114,069 |
| 12 | Netherlands | 101,845 |
| 13 | Sweden | 98,563 |
| 14 | Israel | 89,778 |
| 15 | Australia | 72,883 |
| 16 | India | 53,699 |
| 17 | Finland | 52,259 |
| 18 | Belgium | 47,203 |
| 19 | Austria | 40,176 |
| 20 | Denmark | 35,434 |
*Germany includes West Germany.
Which Company has the Most Patents?
In the 2020 calendar year the USPTO granted 388,861 patents. The top 20 companies were collectively granted 56,665 patents, or 14.57% of all patents granted that year. IBM was granted the greatest number of patents in 2020.
| Organizations with most patents granted in 2020 | ||
|---|---|---|
| Rank | Company | Number of Patents Granted in 2020 |
| 1 | IBM | 9,118 |
| 2 | Samsung Electronics | 6,396 |
| 3 | Canon | 3,225 |
| 4 | Microsoft | 2,909 |
| 5 | Intel | 2,865 |
| 6 | LG | 2,830 |
| 7 | Taiwan Semiconductor | 2,817 |
| 8 | Apple | 2,788 |
| 9 | Huawei | 2,760 |
| 10 | Qualcomm | 2,276 |
| 11 | Amazon | 2,244 |
| 12 | Sony | 2,232 |
| 13 | Ford | 2,025 |
| 14 | Samsung Display | 1,892 |
| 15 | Toyota | 1,874 |
| 16 | BOE Technology | 1,848 |
| 17 | 1,817 | |
| 18 | General Electric | 1,757 |
| 19 | Micron | 1,534 |
| 20 | Hyundai | 1,458 |
How Long Does It Take to Get a Patent?
The USPTO provides data regarding traditional pendency times by different technology groups. Total pendency time is the time after filing the application and before the prosecution of the application is finished.
How long does it take for the USPTO to examine a patent application?: The traditional total pendency time of a patent application is between 20.6 and 29.7 months.
How frequently does the USPTO issue a patent within 3 years of filing?: 86% of patents that issued in 2022 did so within 3 years after the application was filed.
How long does it take to receive a first office action?: The time it takes to receive a first office action is between 14 months and 18.7 months. This time varies by technology group.
What technology is likely to receive a patent the quickest?: A design patent has the lowest total traditional pendency time at 20.6 months. The utility patent technology class with the lowest total traditional pendency time is “2600: Communications” at 23.6 months.
What technology takes the longest to patent?: Patent applications in “1700: Chemical and Material Engineering” have the longest total traditional pendency time at 29.7 months.
How often does the USPTO issue office actions early?: In 2022, the USPTO issued the first office action within 14 months from filing 32.2% of the time on average.
| Traditional Pendency Time by Technology Group | ||
|---|---|---|
| Technology Group | Traditional time for first office action (months) | Traditional time for final rejection or issuance (months) |
| 1600: Biotechnology and Organic Chemistry | 18.7 | 28 |
| 1700: Chemical and Material Engineering | 17.3 | 29.7 |
| 2100: Computer Architecture and Software | 15.3 | 27.1 |
| 2400: Networking, Multiplexing, Cable, and Security | 14.0 | 24.7 |
| 2600: Communications | 13.7 | 23.6 |
| 2800: Semiconductors/Memory, Circuits/Measuring and Testing, Optics/Photocopying, Printing | 15.4 | 25.7 |
| 2900: Design | 16.7 | 20.6 |
| 3600: Transportation, Construction, Electronic Commerce, Agriculture, National Security and License and Review | 16.9 | 27.7 |
| 3700: Mechanical Engineering, Manufacturing, Gaming, and Medical Devices/Processes | 18.0 | 28.2 |

Sheldon Brown
Sheldon received his training of the patent system at the United States Patent & Trademark Office. He works with universities and consultants to provide analytics and guidance for technology commercialization from patents.
Patent Menu
Talk with a Patent Professional
Get a free consultation from a patent professional and protect your invention.
Sources:
- N.A. (2021, May 1) U.S. Patent Statistics Chart Calendar Years 1963-2020. Retrieved from https://www.uspto.gov/web/offices/ac/ido/oeip/taf/us_stat.htm
- N.A. (2022, August 15) Patent Term Adjustment Data. Retrieved from https://www.uspto.gov/dashboard/patents/patent-term-adjustment-new.html
- N.A. (2022 March 18) Patents Data, at a Glance. Retrieved from https://www.uspto.gov/dashboard/patents/
- N.A. (2023, March 20) patent Counts by Origin and Type, Calendar Year 2020. Retrieved from https://www.uspto.gov/web/offices/ac/ido/oeip/taf/st_co_20.htm
- Holly Rosenkrantz (2022, April 1) The High Value of U.S. Patents. Retrieved from https://share.america.gov/high-value-of-us-patents/